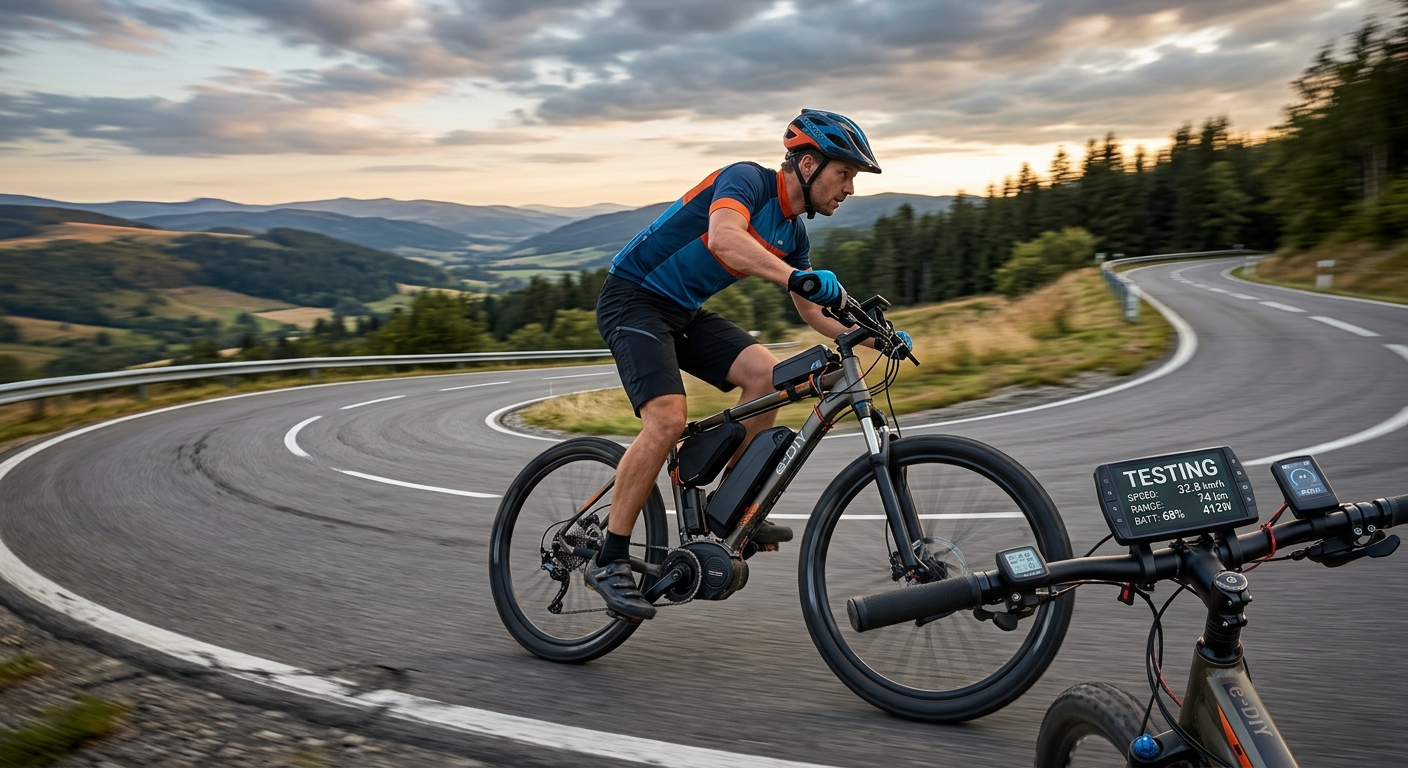
You spent weeks sourcing parts, cutting cables, and fine-tuning your motor mount. The conversion is done. You roll out of the driveway and it feels great. But here is the problem: "feels great" is not a number, and numbers are what tell you whether your build is actually performing the way it should, or whether you are leaving speed, range, or efficiency behind.
Real data beats guesswork every time.
- Timed segments on familiar routes reveal your actual speed gains across assist levels.
- Per-kilometre battery draw shows whether your range claims hold up on real terrain.
- An unpowered baseline on the same route gives you a true before-and-after comparison for your build.
Why Route-Based Testing Beats Spec Sheet Numbers
Controller specs, motor wattage ratings, and battery capacity figures all look promising on paper. Terrain, rider weight, wind, and stop-start traffic change everything. A 500W hub motor on a flat canal path performs completely differently on a hill-heavy commute route.
Route-based testing grounds your numbers in reality. You test your specific build, carrying your specific load, on your specific roads. The data you collect is not generic. It belongs to your bike and your riding pattern, which makes it far more useful for any component or setup decision you face later.
There is another benefit. Once you have a documented baseline, every future change, whether you swap the controller, add a bigger battery, or adjust your gear ratios, can be measured against it. You stop guessing and start comparing.
Building Your Test Framework Before You Ride
Before you turn a pedal, set up a repeatable system. Consistency matters. You want to be able to run the same test three months from now and know the conditions were close enough to make the comparison valid.
Here is what you need before your first test session:
- A GPS-enabled cycling computer or smartphone app that logs speed, distance, and elevation.
- A watt meter or battery monitor that reads voltage, current, and cumulative watt-hours consumed.
- A designated test route you know well, with at least one flat segment and one climb.
- A battery charged to the same percentage before every session (100% is easiest to standardise).
- A simple logbook, either paper or digital, to record ambient temperature, tyre pressure, and rider weight.
Temperature affects battery performance noticeably. A lithium pack in cold weather sheds capacity. Record the ambient temp at the start of every ride so you can flag outliers in your data later.
Timing Your Segments at Different Assist Levels
Pick two or three fixed segments on your test route. A flat 500-metre stretch and a consistent 200-metre climb work well. These become your benchmarks.
Ride each segment at every assist level your controller offers. Many entry-level conversion kits have three to five pedal-assist modes. Record the time to cover each segment at each level and note your average speed from the GPS data. Keep a consistent pedalling cadence throughout. You are testing the motor assist, not your leg strength.
Then ride the same segments with assist turned completely off. This is your baseline. Write it down. That number is the foundation everything else gets measured against.
Sample Segment Performance Across Assist Levels
| Assist Level | Flat Segment Avg Speed | Climb Segment Avg Speed | Measured Wh/km |
|---|---|---|---|
| Off (baseline) | 18 km/h | 10 km/h | 0 Wh/km |
| Level 1 | 22 km/h | 15 km/h | 6 Wh/km |
| Level 2 | 26 km/h | 19 km/h | 9 Wh/km |
| Level 3 | 30 km/h | 23 km/h | 14 Wh/km |
| Level 4 (max) | 32 km/h | 26 km/h | 19 Wh/km |
Over multiple sessions, patterns emerge. Level 3 might give you 40% faster segment times but drain the battery twice as fast. Level 2 might be the sweet spot for your commute. These are real, actionable insights, not marketing figures.
Logging Battery Draw Per Kilometre
Wh/km (watt-hours per kilometre) is the metric that matters most for range planning. It tells you how much energy your build consumes per unit of distance, accounting for your actual route and riding style.
To calculate it, note the watt-hours consumed from your battery monitor at the end of a known-distance ride. Divide by the total kilometres. If you rode 15 km and consumed 90 Wh, your consumption rate is 6 Wh/km.
Most DIY conversions with a 36V or 48V system and a mid-range hub motor land somewhere between 8 Wh/km and 20 Wh/km depending on terrain, assist level, and rider weight. Published averages for electric bicycle efficiency vary so widely between builds and terrains that they serve mainly as rough orientation points, which is exactly why collecting your own route data is worth the effort.
Run this calculation for each assist level on your test route. Now you can do actual range maths. A 480 Wh battery at 8 Wh/km gives you 60 km. At 15 Wh/km on a hilly route, that drops to 32 km. These figures tell you whether your current pack is sized right for your use case.
Running an Honest Unpowered Baseline
This step is one that many builders skip, and it is a mistake. Before you can claim your conversion made your commute faster or easier, you need to know what "before" looked like.
If you have not already, do a full unpowered ride of your test route. Same bike. Same gearing. Same load. Record segment times, total time, and any effort notes. This is your control condition.
If your conversion is already complete and you never ran this test, you can still approximate it. Ride with assist fully off and throttle disconnected. The added motor and battery weight changes the bike slightly, but it gives you a close enough reference to work with.
That baseline does two things. First, it shows you the real-world performance gain your conversion actually delivers. Second, it sets a floor. If your powered rides are only marginally faster than the baseline at high assist levels, that is a red flag about motor sizing or controller tuning, not something to shrug at.
Tracking Performance Across Multiple Rides and Group Events
A single test session is useful. A month of test sessions is a picture. As your data set grows, you move from snapshots to trends.
If you ride with a club or take part in timed group events, correlating your e-bike metrics with timed event data adds another layer of insight. Sports result tools give riders a structured way to pull up event times alongside their own records, which makes it possible to line up your build's performance metrics with your actual outputs during competitive or group ride conditions.
For a conversion builder, that context is valuable. A group ride shows how your assist levels interact with variable pace, group dynamics, and real-world start-stop behaviour, conditions that a solo test loop does not fully replicate. If your Wh/km figures spike during group rides compared to solo testing, that tells you something specific about how the motor handles surge demand.
Build a simple spreadsheet with these columns: date, temperature, total km, Wh consumed, Wh/km, assist level used most, and any notes. Update it after every ride. After four to six weeks you will have enough data to see genuine patterns and make meaningful comparisons.
Reading Your Numbers to Make Build Decisions
When the Motor Might Be the Limiting Factor
Signs that your motor is undersized for your use case:
- Climb segment times are barely better than your unpowered baseline, even on high assist.
- The motor casing runs hot after moderate climbs, beyond a comfortable hand-hold temperature.
- Your controller cuts power mid-climb, which typically means it is hitting a thermal or current limit.
In these cases, a motor with higher nominal wattage or stronger torque characteristics, often a mid-drive over a hub motor, is the right focus before you consider adding battery capacity.
When Battery Capacity Is the Constraint
If your segment performance is strong but your total range falls short, the battery is where to direct your attention. Use your Wh/km figure to calculate exactly how much capacity you need for your target range. Add a 15 to 20 percent buffer for pack degradation and cold weather performance loss.
A worked example using your own data:
- Target range: 50 km
- Measured Wh/km at your preferred assist level: 10 Wh/km
- Gross capacity needed: 500 Wh
- Add 20% buffer: 600 Wh
- At 48V, that means a battery of at least 12.5 Ah (12.5 x 48 = 600 Wh)
That is your actual data telling you precisely what you need, not a guess based on someone else's review of a different build on a different route.
Gear Ratio Adjustments Based on Speed Data
Speed data from your segments also informs gearing decisions. If you are spinning out at assist level two or higher on flat ground, your gearing is too low for a motorised setup. A larger chainring or smaller rear sprocket lets the motor operate in a more efficient RPM range and improves feel at cruising speed.
Conversely, if climbing in your lowest gear still demands high assist just to maintain pace, a smaller chainring shifts more torque load to the drivetrain and reduces demand on the motor. Small gear changes have a measurable impact on efficiency, and your Wh/km log will confirm whether an adjustment worked.
From Numbers on a Screen to a Build You Can Trust
Data without interpretation is just noise. But once you have a few weeks of consistent route measurements, the picture becomes clear. You will know exactly which assist level gives you the best efficiency for your commute. You will know whether your battery is sized for your actual usage. You will know whether a motor upgrade is genuinely warranted or whether a gear tweak solves the problem for free.
Start with one consistent test route. Measure it unpowered. Then measure it at every assist level with your current setup. Log the Wh/km figures. Compare them over time. When you change a component, record it.
That is the whole system. It is not complicated. But it is the difference between a builder who upgrades based on forum speculation and one who upgrades because the numbers said it was time.
Your conversion is a machine you designed and built. It deserves to be tested like one.